Data center application
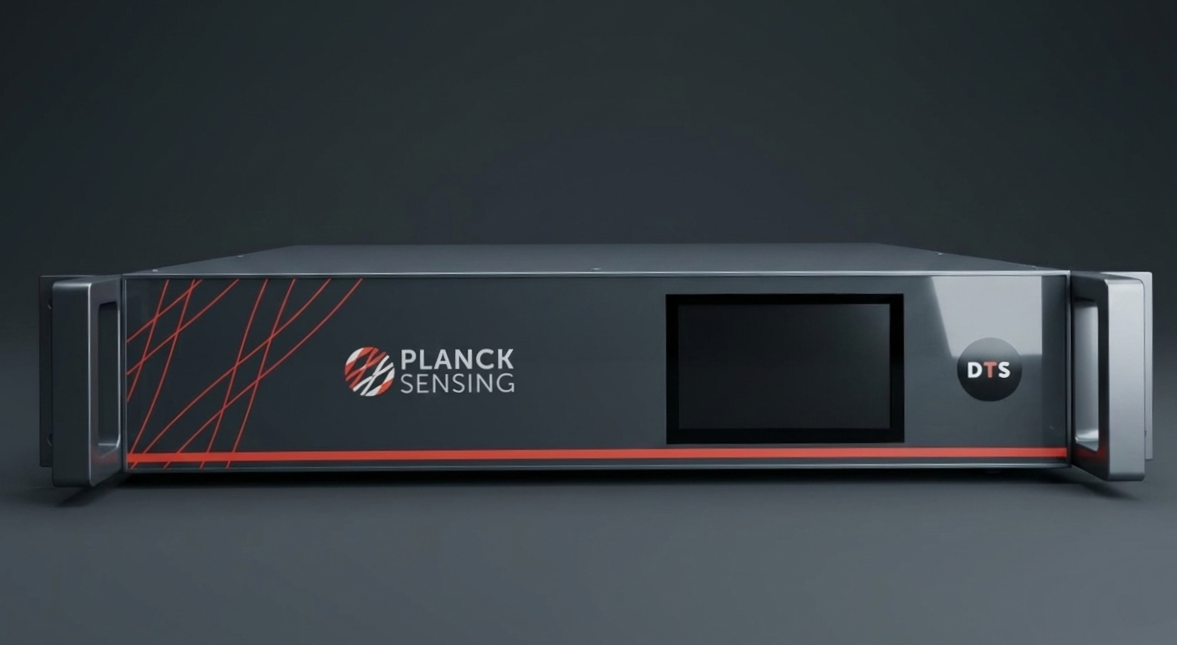
A fiber-optic sensing cable follows the bus duct or busway and measures temperature continuously. The system locates hot spots by distance and connects alarms to named joints for faster, clearer investigation.
0.3 m
Spatial resolution
1 s
Measurement time per channel
4
Optical channels
Application workflow
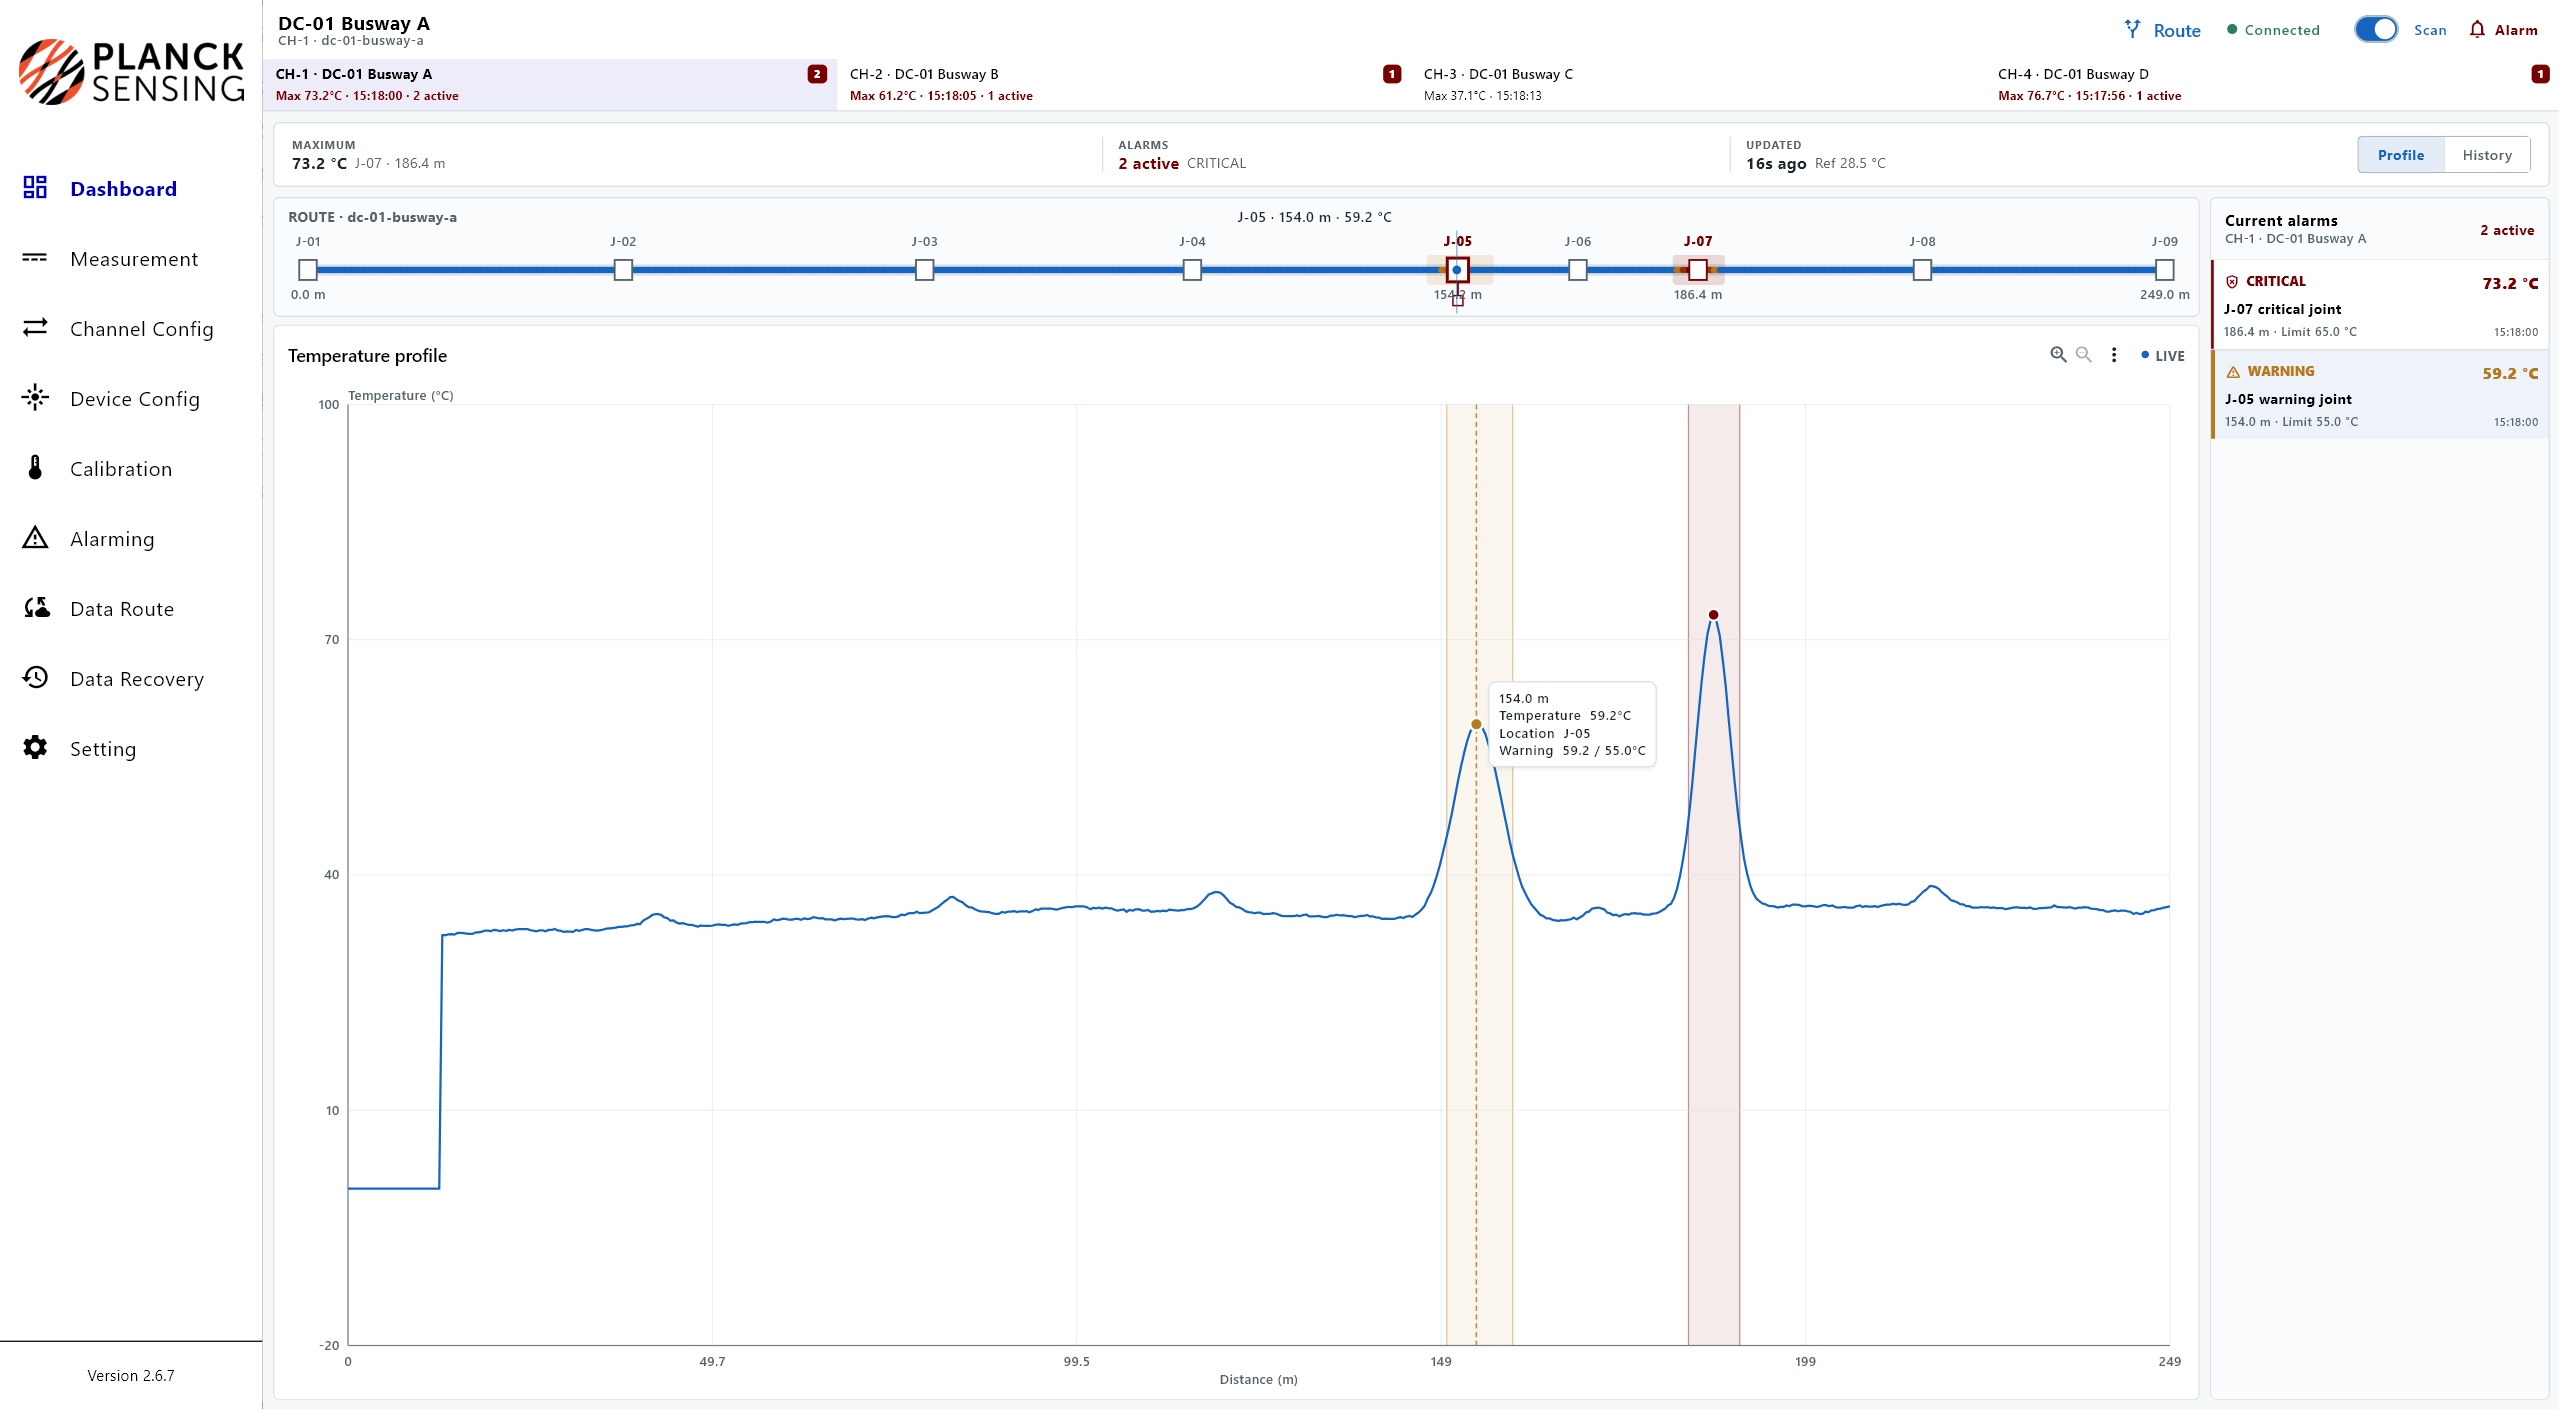
The sensing route is mapped to busway names and joint positions. Software then brings the live profile, route context, alarm status, and thermal history into one application view.
View temperature by distance along each monitored busway instead of relying only on measurements at isolated points.
Keep the channel, joint ID, route distance, measured value, alarm limit, and time connected in the same workflow.
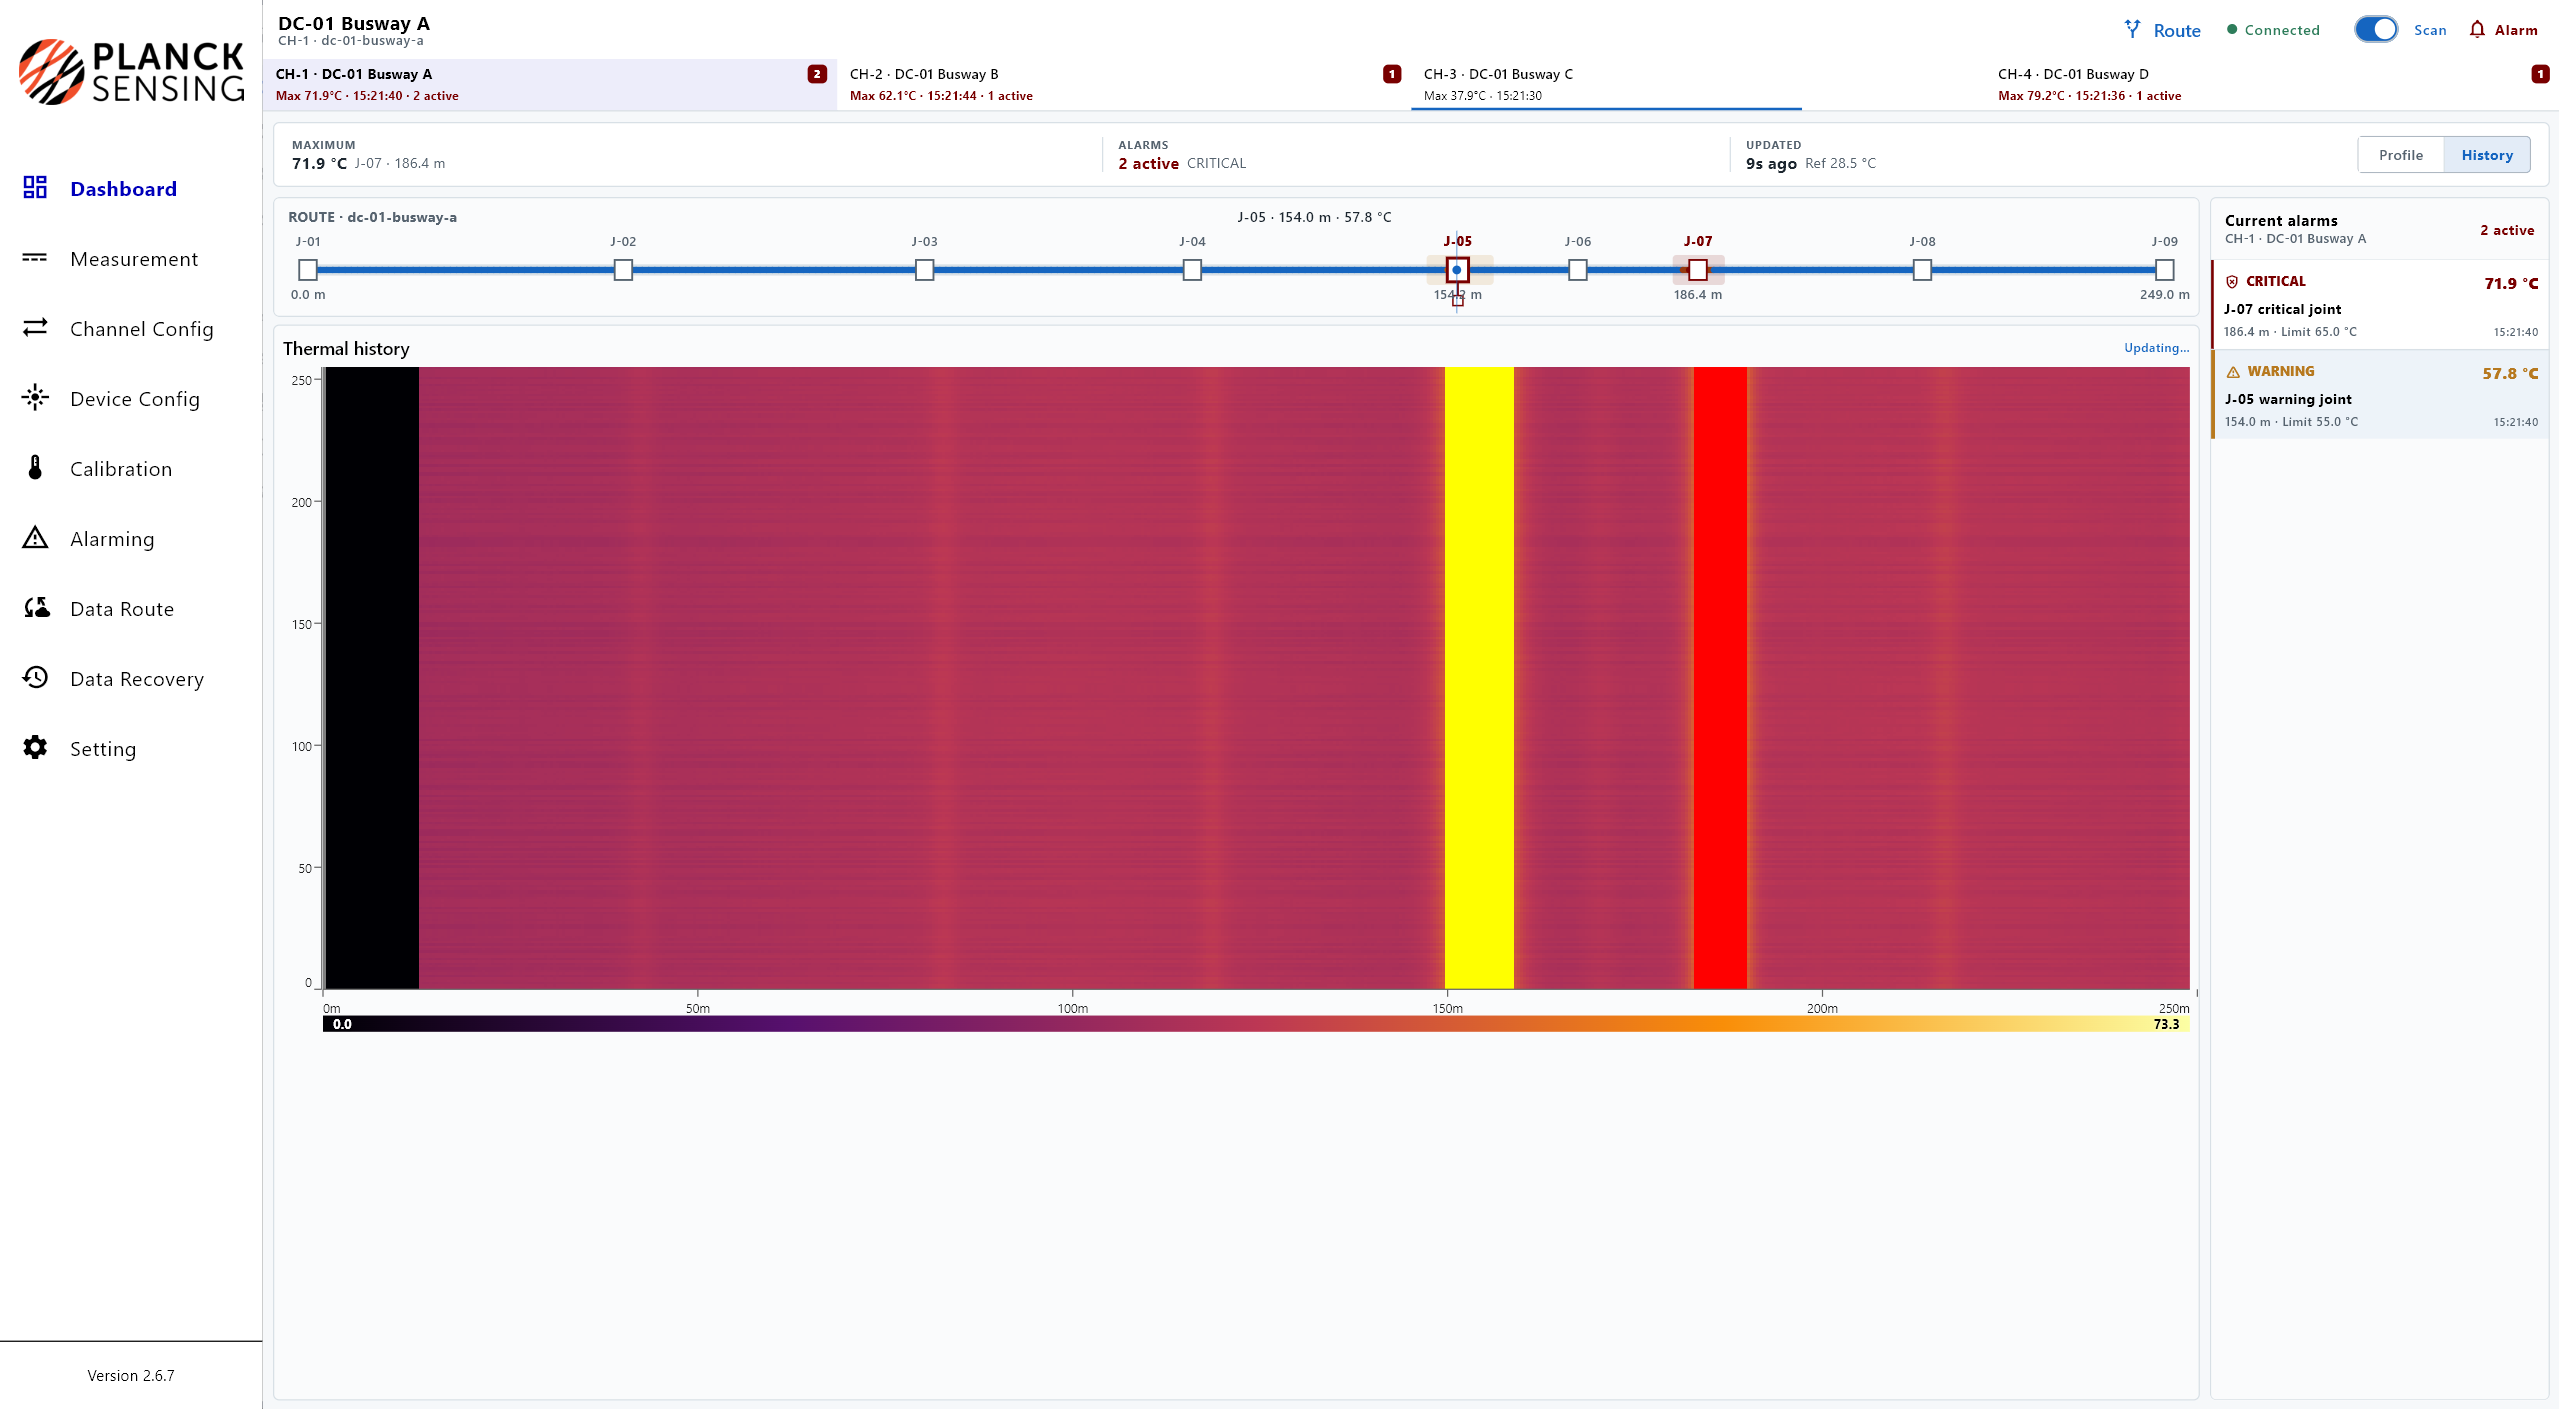
Use the current temperature profile for active events and the waterfall history to identify repeated or persistent heating.
Connect data and alarms through Ethernet, REST API, WebSocket, RS485 Modbus, or dedicated alarm relay outputs.
Live temperature profile
Temperature peaks align with named joints and alarm zones. Each active alarm can show its severity, measured value, limit, route distance, location name, and time.
Thermal history
A waterfall view adds time to the distance-based temperature profile. Repeated heating remains visible at the same route position, helping teams distinguish persistent conditions from a single scan.
DTS complements the data center's electrical protection and inspection procedures by adding continuous temperature visibility along the monitored route.
Representative configuration
These values summarize the PS-DTS-5KM-MM-E2000-01 configuration used in the application brief. Final equipment, sensing cable, alarm thresholds, and channel allocation should be matched to the actual busway layout.
Explore DTS equipment| Specification | PS-DTS-5KM-MM-E2000-01 |
|---|---|
| Sensing range | Up to 5 km |
| Measurement time | 1 s per channel |
| Spatial resolution | 0.3 m |
| Temperature resolution | 0.1°C |
| Temperature accuracy | ±2°C at 2 km, 6 s |
| Optical channels | 4 with optical switch |
| Standard cable range | -20 to +120°C |
| System format | 19-inch 2U rackmount |
| Interfaces | RS485 Modbus; Ethernet; REST API; WebSocket |
Representative specifications are subject to change. Confirm current specifications for the selected configuration.
Discuss your route
Planck Sensing can help align the DTS configuration, sensing route, software views, and integration outputs with your data center application.