
From indoor facilities to outdoor infrastructure, a recent industrial park deployment offered a practical look at Planck Sensing’s Distributed Temperature Sensing (DTS) technology in the field. Approximately 1.25 km of sensing fiber brought temperature measurements from several environments into a single route-based view.
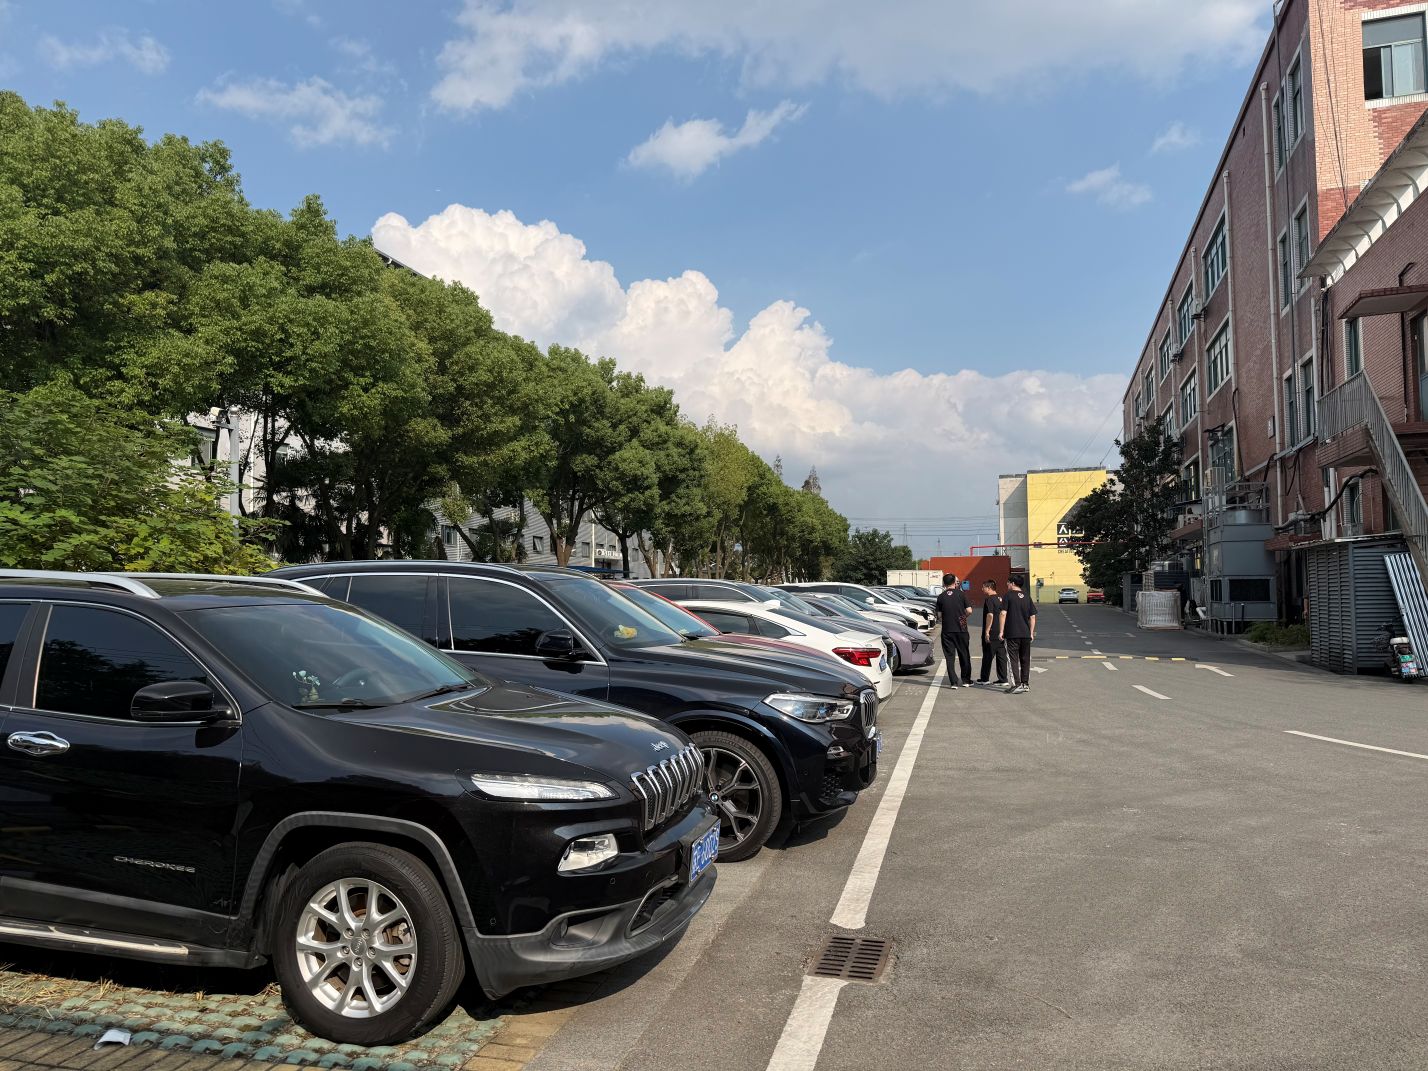
One sensing route across different environments
Industrial parks bring together pipelines, utility corridors, buildings, and outdoor facilities, each exposed to different temperature conditions. Monitoring these assets with individual point sensors can require many separate measurement locations. DTS uses the optical fiber itself as the sensing element, providing a continuous temperature profile along its length.
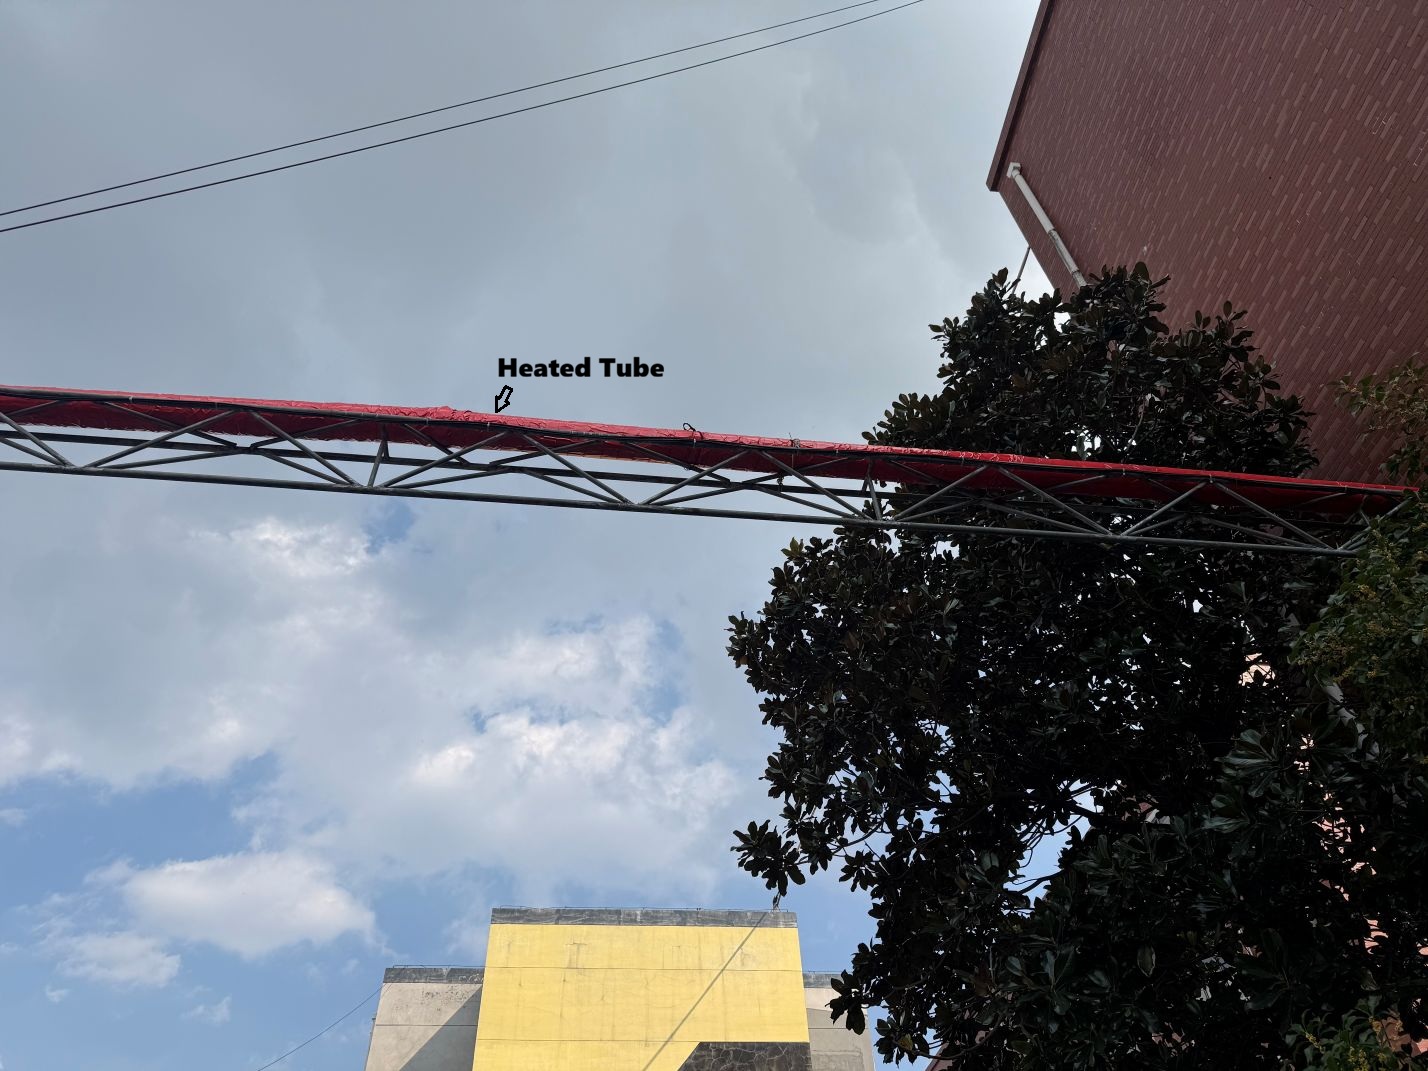
In this deployment, the sensing route passed through indoor areas, rooftops, underground sections, and heated sections. The setup also included floor and rooftop fiber coils. The approximately 1.25 km figure describes the sensing fiber length, including those coils, rather than the physical distance covered across the park.
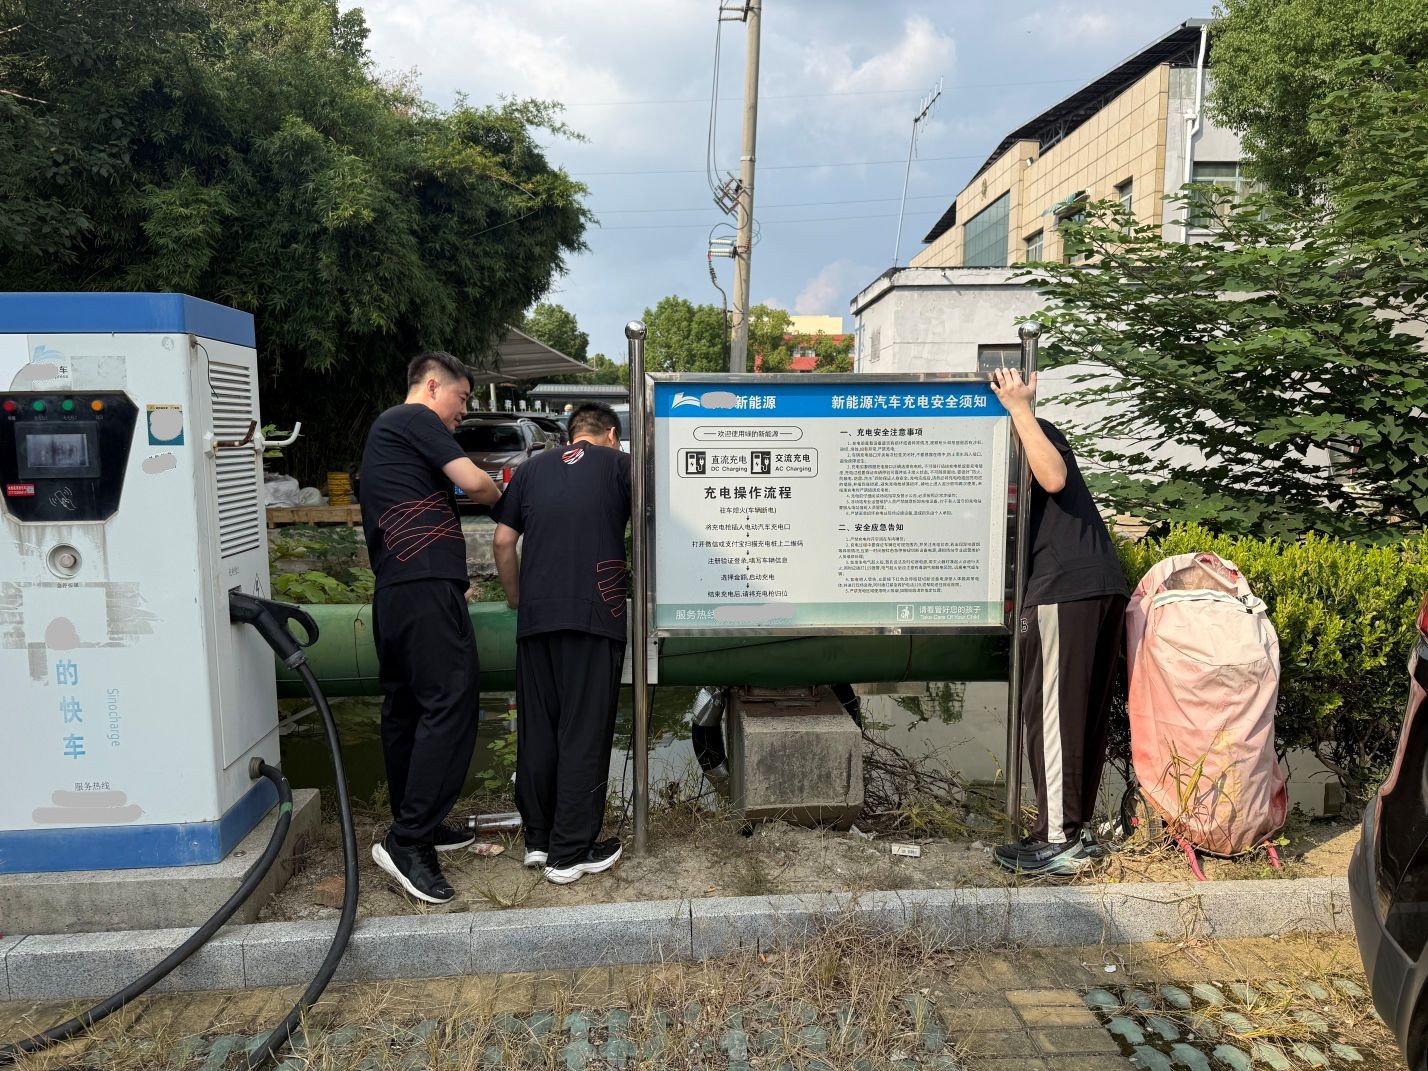
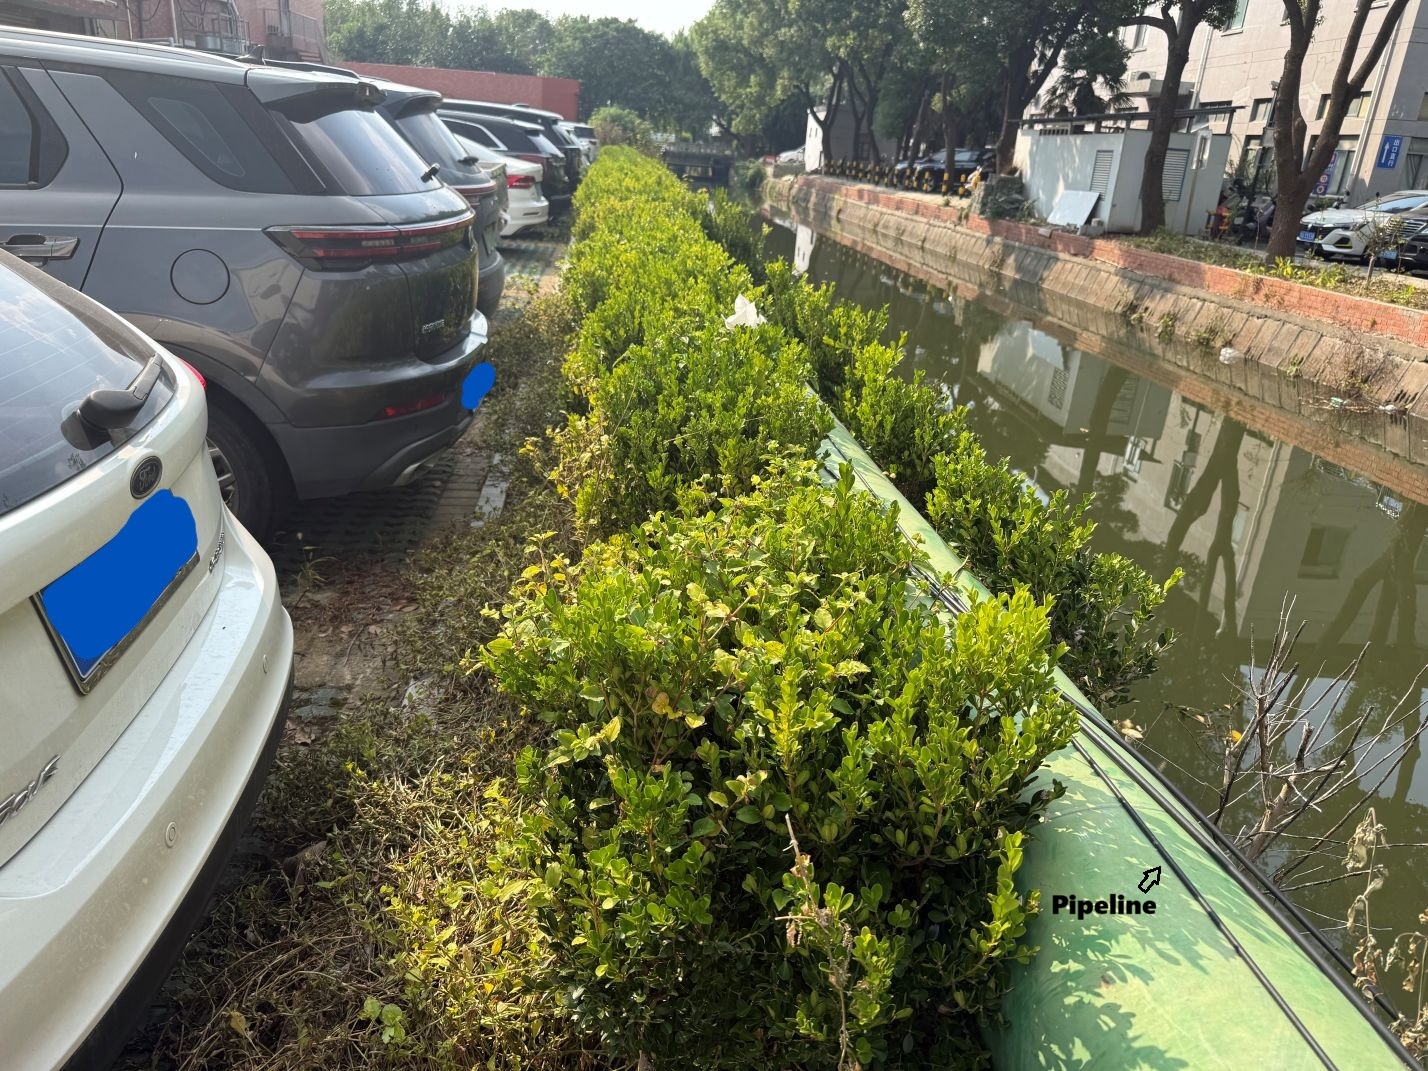
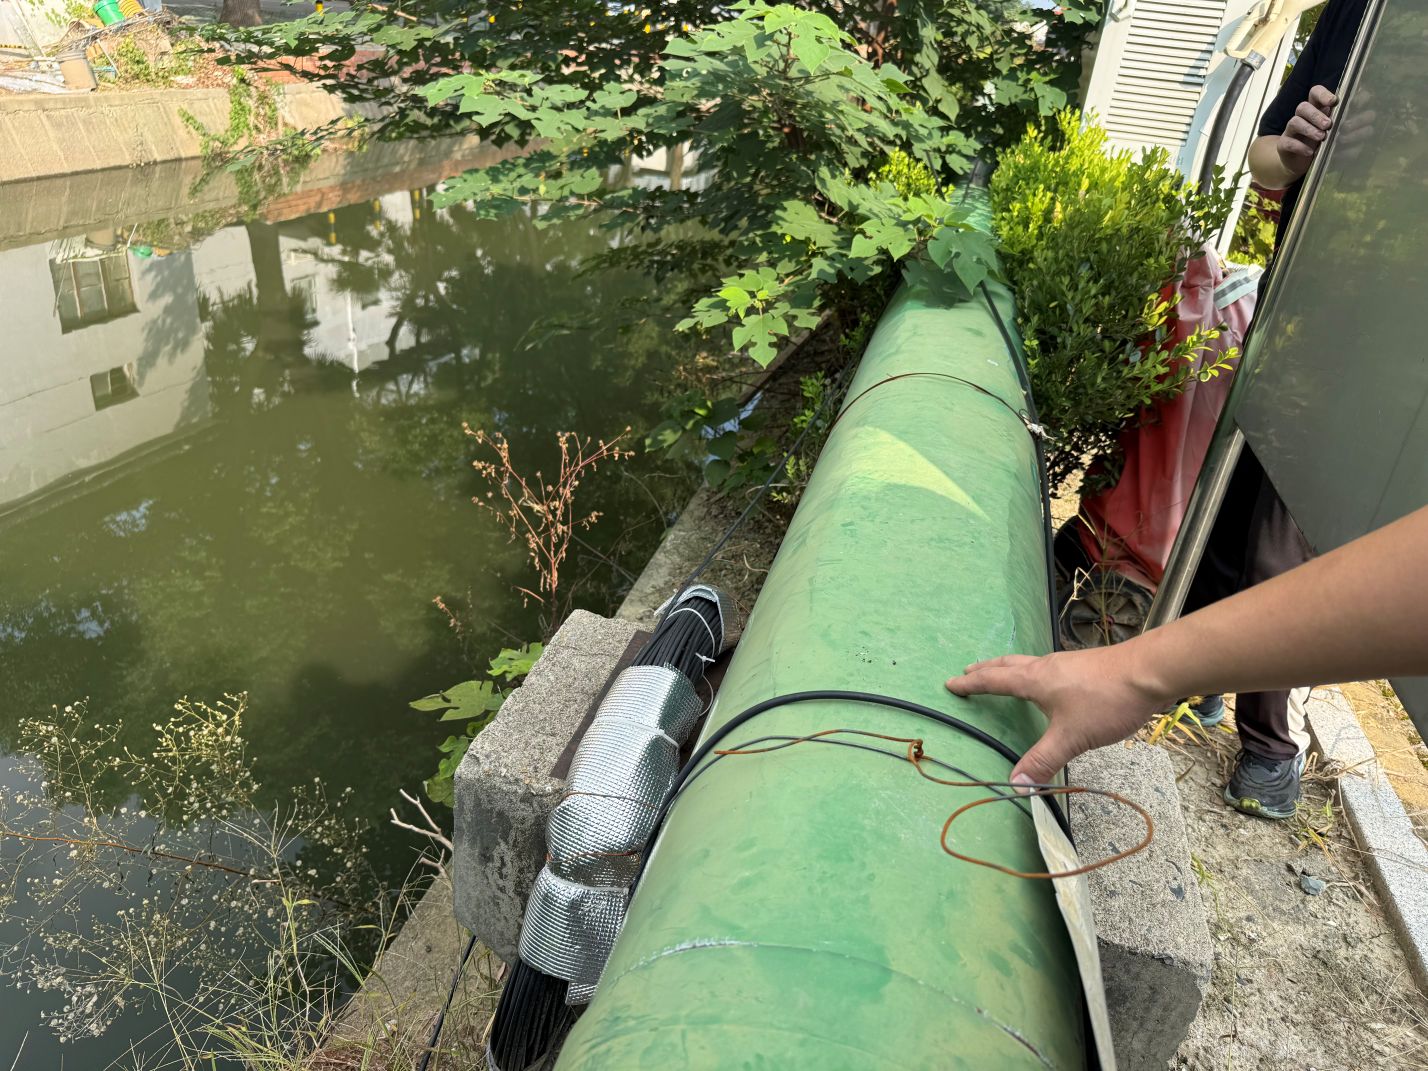
Reading temperature by location
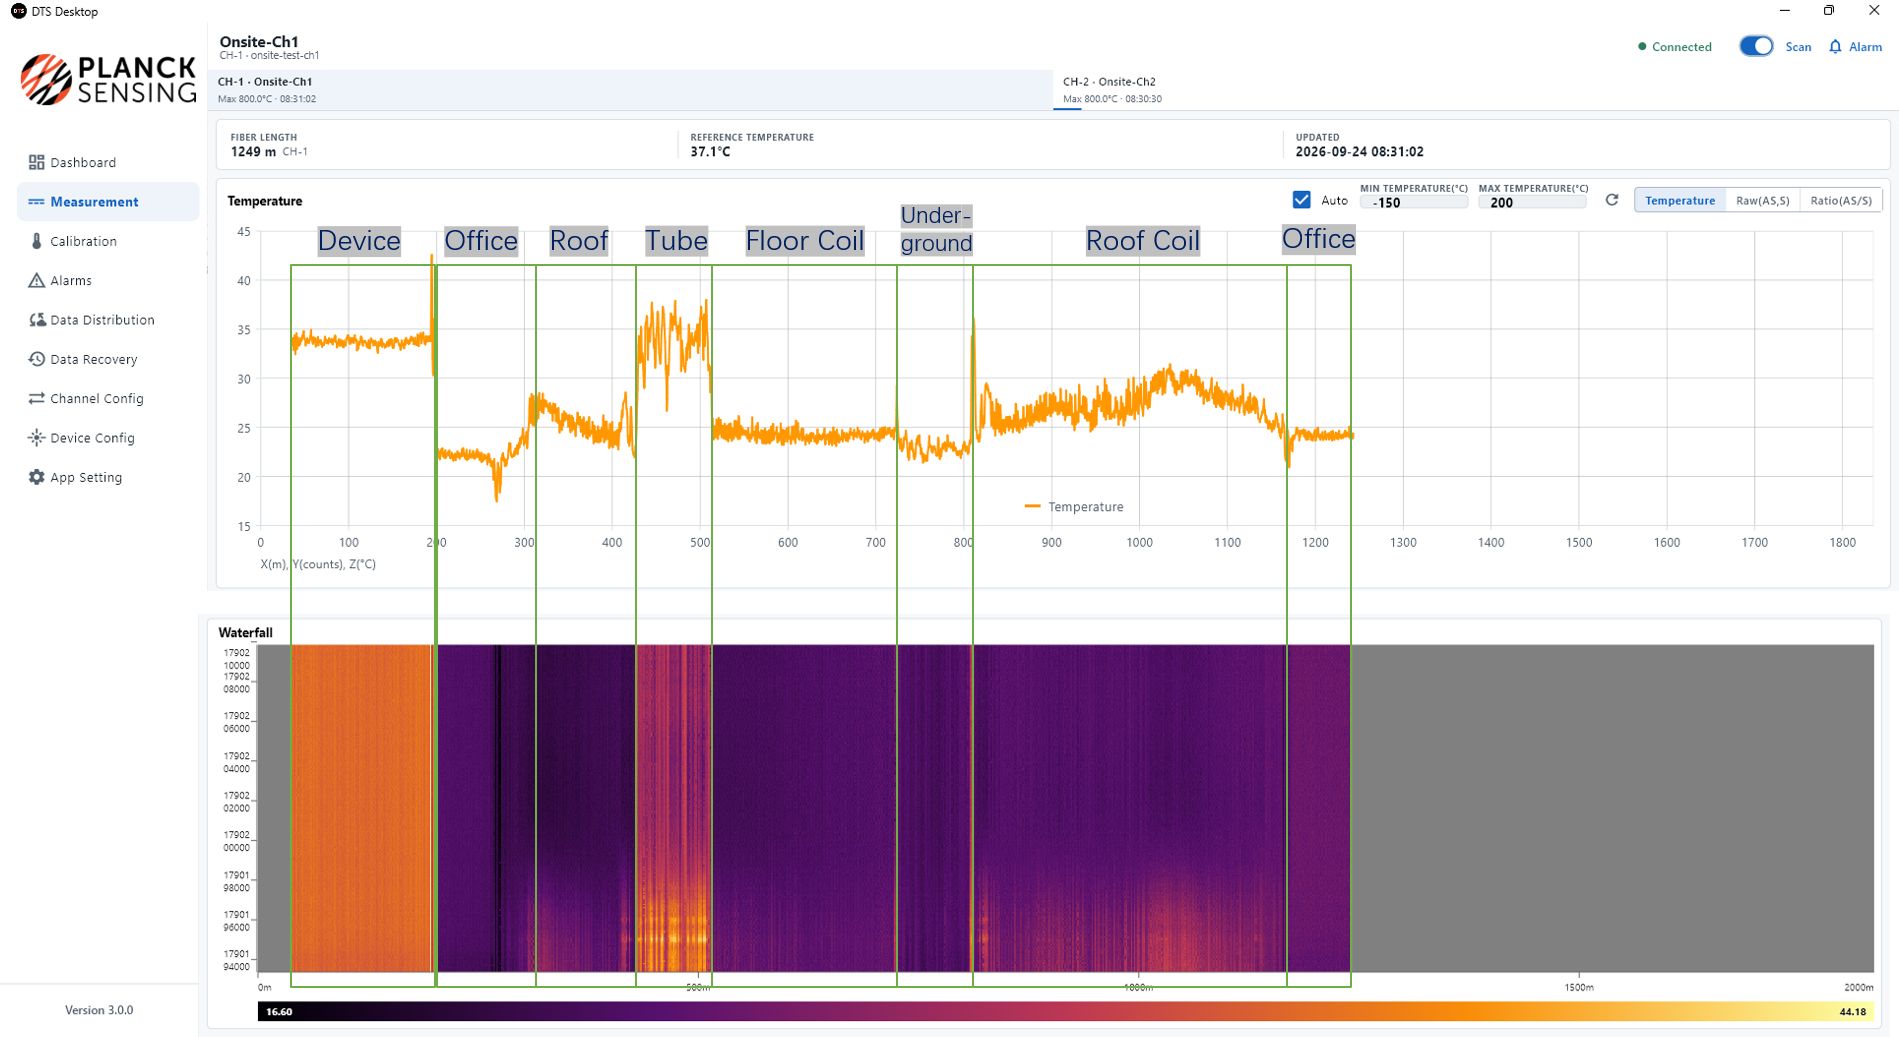
The measurement data shows distinct thermal profiles along 1,249 m of sensing fiber. The annotated view identifies device, office, roof, tube, floor-coil, underground, and roof-coil sections, connecting the temperature trace with the environments along the route.
This context matters when interpreting a temperature change. A warmer section may correspond to a heated tube or an exposed rooftop, while a localized change within a section may warrant closer inspection. Mapping fiber distance to the installation helps operators locate the area to investigate.
Following changes over time
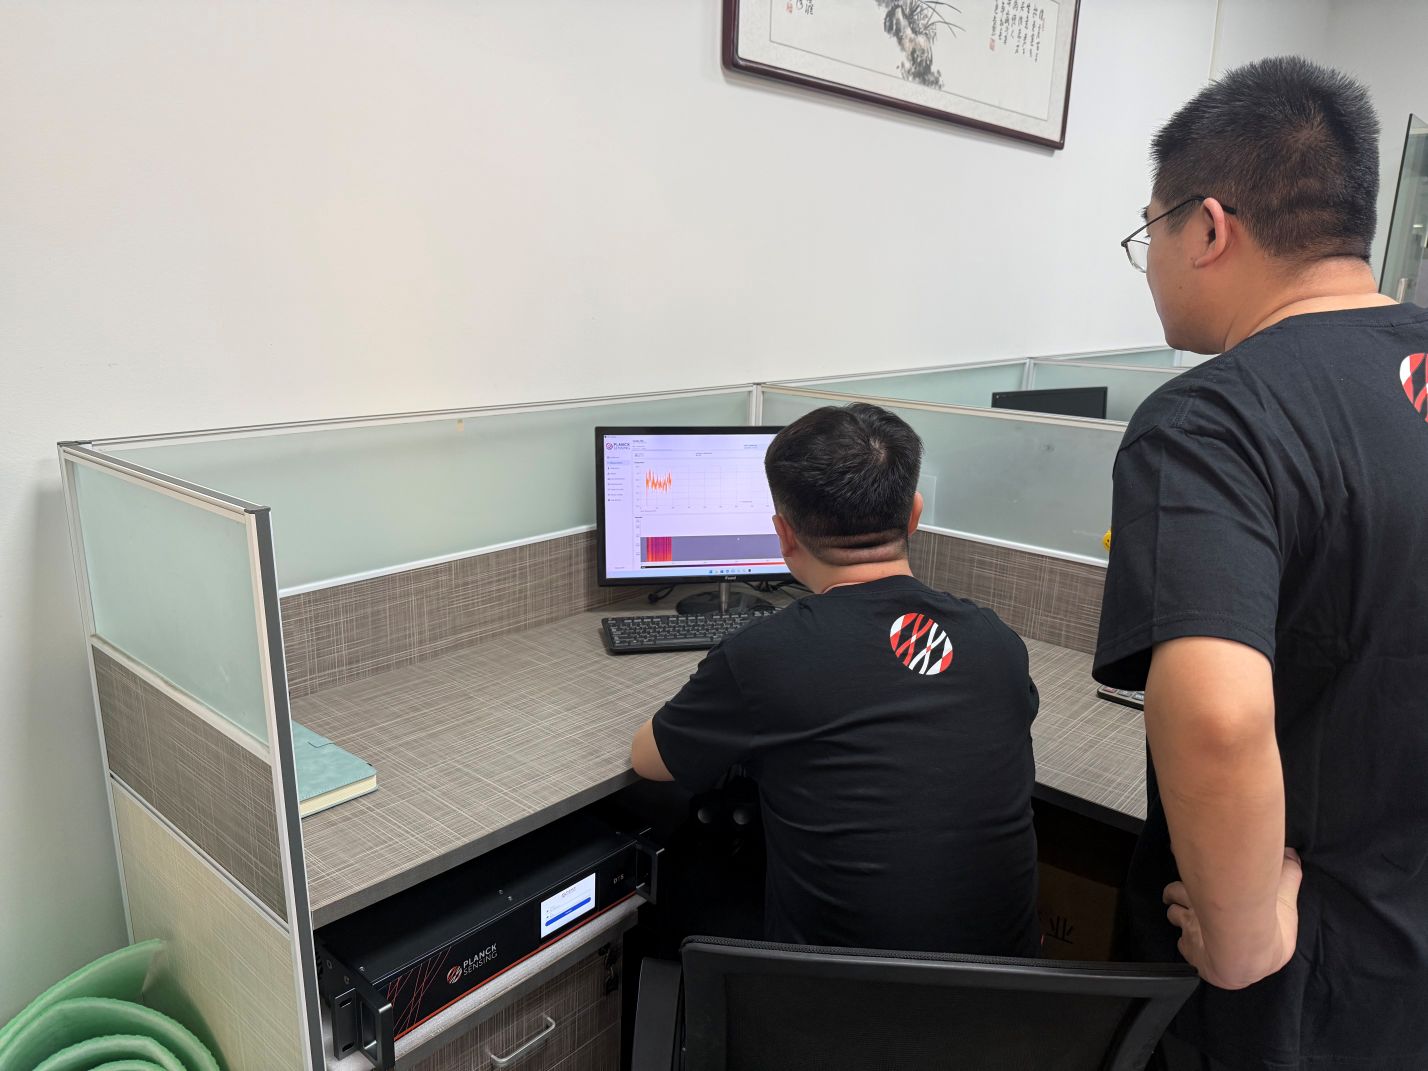
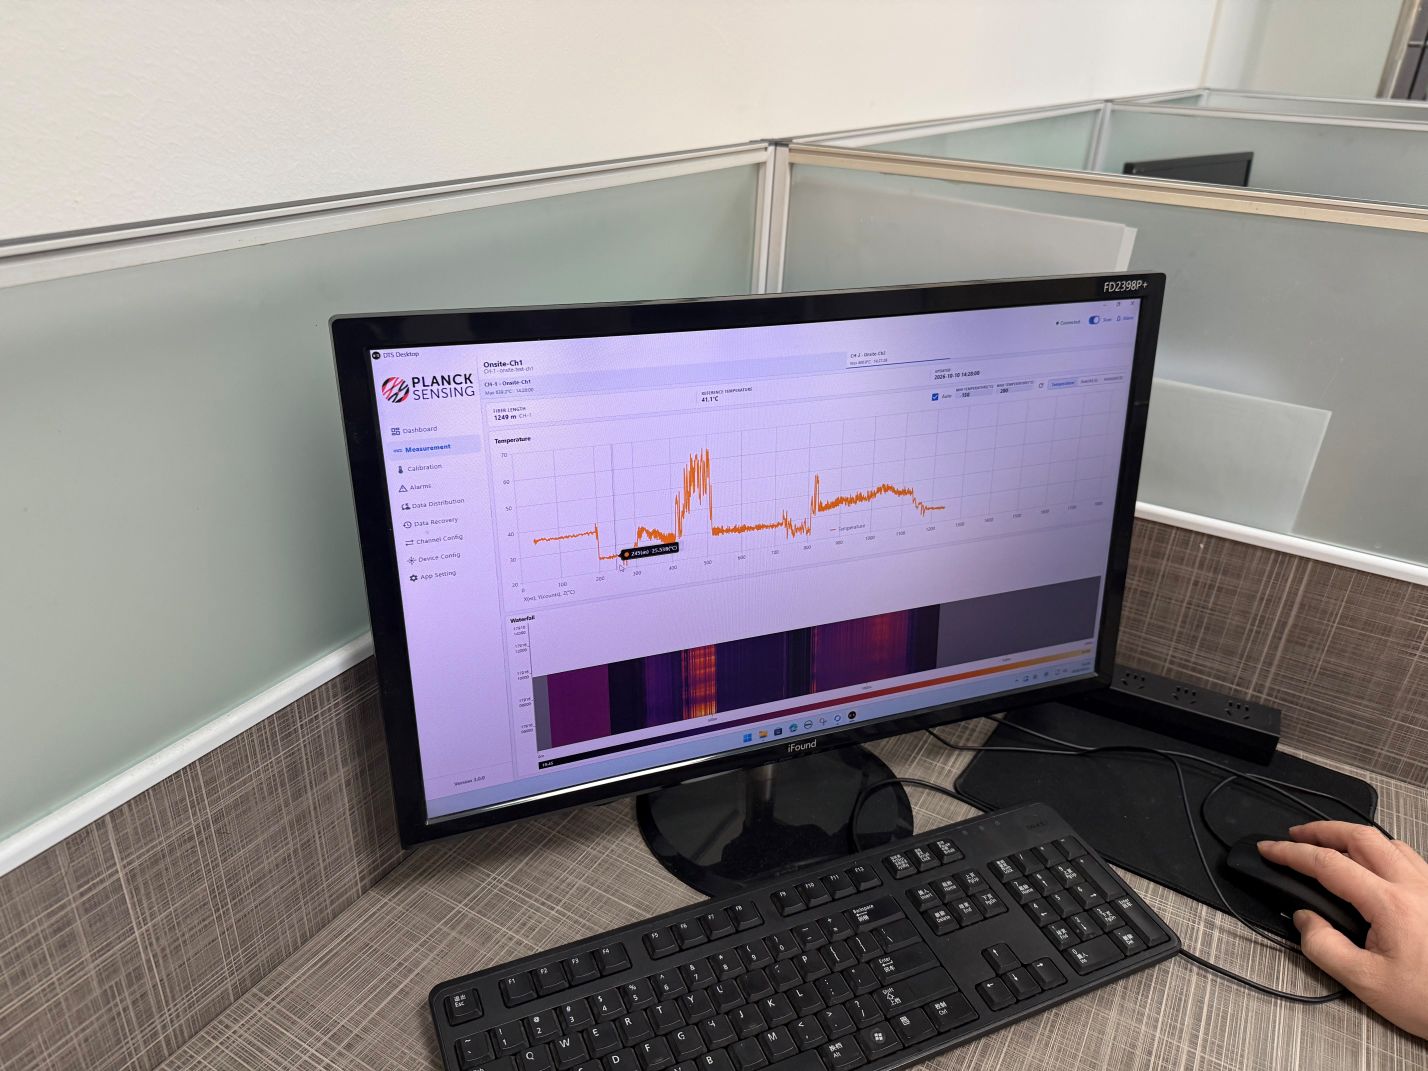
A live temperature profile shows conditions along the route at a particular moment. The historical waterfall adds another dimension: how those conditions develop over successive measurements. Viewed together, they help operators identify where heating occurs and whether it persists or changes over time.
The deployment illustrates four useful capabilities of DTS:
- Continuous temperature profiles along the sensing route.
- Spatial localization of temperature changes and potential hot spots.
- Historical monitoring, with waterfall visualization showing how temperature evolves over time.
- Coverage across different environments, from indoor spaces to outdoor infrastructure.
Applying DTS to industrial infrastructure
For industrial park operators, this approach can support temperature monitoring along utility pipelines, power cable routes, and other temperature-sensitive facilities. The equipment configuration, fiber placement, and software workflow can be matched to the assets and operating conditions being monitored.
The value of DTS extends beyond a temperature reading: it connects that reading with a location and a history. That combination gives teams a clearer basis for investigating changes and prioritizing inspection.
Explore Planck Sensing DTS equipment, read about pipeline monitoring and power cable monitoring, or discuss your application with our team.